1. Executive Summary
In July 1985, Warren Buffett shut down a textile business. It was the business that gave Berkshire Hathaway half its name, and he had owned it for 21 years. In his letter to shareholders that year, he explained why — and the story he told was not about textiles. It was about a trap, and the trap had a name. It was called Burlington.
Burlington Industries was the biggest textile company in America. It was bigger than Berkshire and better run than Berkshire. From 1964 to 1985 it spent about $3 billion on new machines and bigger plants — over $200 a share on stock that had started at $60/share. By the end, the stock was still around $60/share, and the dollar had lost two-thirds of its value. Buyers got cheaper cloth. Workers got jobs. Equipment makers got orders. Shareholders got nothing.
Buffett’s lesson was simple. When ten companies in the same industry all expand at the same time, the gains do not stay with any of them. The market eats the gains. Each company looks smart on its own; together they cancel each other out. That is the Burlington effect.
This article tests one question: is Indian steel walking into the same trap? On 20 years of audited data for the two largest private producers — Tata Steel and JSW Steel — the answer is that it already has.
Between FY06 and FY25, the combined capital employed of Tata and JSW grew from about ₹20,000 crore to about ₹2,89,000 crore — a 14× jump. Combined operating profit (EBIT) grew only by about 5×. The arithmetic of that mismatch is the whole story. Tata Steel’s standalone return on capital, measured on its Indian business after stripping out the Corus acquisition, fell from 43.7% in FY06 to 16.3% in FY25. JSW’s fell from 24.3% to 8.8%. Putting the two together and combined ROCE has dropped from 36.0% to 12.4% right onto the 12% line that a steel maker must clear just to pay for its capital.
The government wants industry capacity to grow from about 220 million tons a year (MTPA) today to 300 MTPA by 2030 and 400 MTPA by 2035. JSW alone is going from 30 to 50 MTPA. Tata is taking Kalinga Nagar from 3 to 8 MTPA. Every major player is building at the same time. Exactly as Burlington’s competitors did.
Two outside forces make our trap tighter than Burlington’s. China has too much steel and dumps it here whenever Indian prices try to rise. And from January 2026, Europe’s carbon border tax (CBAM) adds an estimated 15–22% cost to Indian steel sold into the EU — once India’s largest export market. The price ceiling is real. The export door is closing.
The deeper point is not steel. It is the one question every CEO of a commodity business must answer. Not “can we sell the volume?” — the volume always sells. The question is “what return will the capital earn?”
2. The Burlington Trap, in Plain Language
Why did Burlington fail its shareholders? Here is the punchline: the capex was not wrong on its own. Each project, looked at alone, cleared its hurdle. The mistake was the assumption underneath all of them — that textiles were a place where capital could earn its keep. It was not.
A business is a Burlington trap when three things are true at once.
One. The product is a commodity. A bedsheet from Mill A looks the same as a bedsheet from Mill B. The buyer pays no premium for either. The market sets the price.
Two. The plant is huge and lumpy. You cannot add 5% of a steel mill. You build a whole blast furnace, or you do not. Capacity arrives in big, discrete steps.
Three. Every player must invest to keep up. If your rival adds a faster, cheaper line and you do not, your costs are higher and you lose. So, you match. Everyone matches everyone.
When all three are true, capex creates volume but not value. The savings leak out of the industry. They go to the customer who pays less, to the equipment maker who sells the line, to the workers who run it. They do not reach the shareholders who paid for it.
This is game theory, not industry folklore. Picture ten farmers around one shared field. Each can put one more cow on it. One more cow means more milk for that farmer, so every farmer adds a cow. Soon there are too many cows, the grass runs out, and every cow gives less milk. Each farmer was right on his own. Together they wrecked the field. That is what Buffett meant by “rational when viewed individually, irrational when viewed collectively.” It is the most quoted line in the 1985 letter and the most useful one.
The framework has been held true for 40 years. It explained airlines, where new planes and routes arrive in waves and returns get crushed. It explained merchant power, where every utility builds at once and prices crash. It explained much of American car-making for half a century. And it explains, with painful precision, where Indian steel is heading.
3. Why Steel Can Never Discipline Its Own Capacity
Before turning to India, a fair objection deserves an answer. If returns fall whenever everyone builds at once, why do steel companies keep doing it? Why does the industry not simply stop — add a little less, wait for prices to recover, let returns heal? The answer is that steel is almost uniquely incapable of disciplining its own capacity, and the reason is structural, not a failure of any one management team. It is the same in every country that makes steel.
The capacity trap: easy to build, almost impossible to close
Most industries have one gate. Steel has two, and both are jammed. Economists call it a “capacity trap”: high barriers to entry and high barriers to exit at the same time.
Entry is hard because a greenfield integrated mill costs roughly $1,000–1,200 per ton of annual capacity and takes 15–25 years to pay back — several billion dollars for a single 3 MTPA plant. Only the largest corporations or state-backed entities can build at that scale. That should, in theory, keep supply in check.
But exit is even harder, and that is the real problem. A blast furnace cannot become anything else. You cannot repurpose it into a warehouse or sell the kit to a different industry. Once the money is spent, it is sunk. Closing a large integrated site triggers environmental remediation that can run past $500 million, plus worker-severance obligations of hundreds of thousands of dollars per employee. So, the rational decision for an owner is to keep the furnace running if it covers its cash costs — even when it earns nothing for the capital, and even for years on end.
The OECD put this precisely in its study of the sector. When the United States needed to cut integrated steel capacity decades ago, it did close plants — but the contraction “took a long time, even though capital was earning subnormal profits for many years.” That single sentence is the whole mechanism. In a normal industry, low returns trigger fast exit, supply tightens, and prices recover. In steel, low returns trigger almost no exit at all. The capital just sits there, producing, dragging the whole industry’s returns down with it.
Governments make the exit gate even stickier
The market would eventually force the weakest mills to close. Governments rarely let it. A steel closure is a regional employment shock and, increasingly, a national-security headline, so states step in — with subsidies, soft loans, rescues, and forced sales to “save” the plant. The OECD’s verdict is blunt: exit barriers in steel “mainly stem from government interventions that hinder the closure of inefficient or unviable steel plants.” Subsidies do not just keep zombie mills alive; they also subsidize brand-new uneconomic capacity that the market would never have financed. The gate that should let weak capacity out is welded shut, and a second gate is being propped open for more to come in.
This is a global condition, not an Indian one
If this were unique to India, it would be a management story. It is not. It is the defining feature of the world steel market. At its March 2026 meeting the OECD Steel Committee warned that global excess capacity had reached roughly 640 million tons in 2025 — more than 200 million tons above the entire steel production of all OECD countries combined and projected to rise toward 721 million tons by 2027. That surplus alone is about seven times the total steelmaking capacity of the United States. China is the central driver: its domestic demand is falling as construction and real estate shrink, yet its capacity has barely adjusted, so the surplus is pushed out into world markets.
The consequence shows up in returns everywhere. The Boston Consulting Group, studying global steel makers, found that when you compare the industry’s return on invested capital against its cost of capital, “more often than not” the return is no longer enough to cover the cost and create value — and it traced the cause directly to “regional overcapacity or high net imports.” In capital-heavy industries a 6–10% return is normal; analysts call a 10% return “excellent for a steel manufacturer.” That is the bar Indian steel is now scraping against. Decades of trade tools — antidumping duties, safeguard measures, multilateral talks — have failed to fix it, because, as the OECD notes, those tools were never designed to address systemic overcapacity in the first place.
Read the Burlington effect and the capacity trap together. Burlington describes the entry side: everyone builds at once, so the gains cancel out. The capacity trap describes the exit side: nobody closes, so the excess never clears and prices stay capped. India is running the entry side at full speed. The world’s 640-million-tonne surplus is the exit-side failure that caps Indian prices from above. The two mechanisms reinforce each other — and that is why this trap, once entered, does not spring open on its own.
4. Indian Steel Today — The Setup
In 2013, India had about 97 million tonnes of installed steel capacity. Today it is around 220 million tonnes. The government wants 300 million tonnes by 2030 and 400 million tonnes by 2035 — a doubling in twelve years and then another 100 million tonnes on top. The blueprint is the National Steel Policy 2017, which set the 300 MTPA target and estimated investment of around ₹10 lakh crore, or roughly ₹6 lakh per tonne of new capacity. Almost all of it will come off listed-company balance sheets.
Look at who is building. JSW Steel is going from 30 to 50 MTPA. Tata Steel is taking Kalinganagar from 3 to 8 MTPA and absorbing NINL, with plans to grow it further. ArcelorMittal Nippon Steel India is expanding Hazira from 9 to 15 MTPA and building greenfield capacity in Andhra Pradesh. JSPL is taking Angul from 6 to 16 MTPA. SAIL has fresh capex approved. Every major player, at the same time, into the same market. This is precisely what the 1985 letter warned about.
Steel men have a ready answer: demand is growing, India needs the steel, per-capita consumption is a third of the world average. Cars, buildings, railways and defence all need steel, and 8% annual demand growth is real. None of that is wrong. But it answers the wrong question. A baker can sell every loaf he bakes; that does not mean every new oven he buys earns its price. The volume will sell. The question is what the capital earns.
Two outside forces tighten the squeeze. The first is China. It has roughly a billion tonnes of capacity, makes around a billion tonnes, and uses about 850 million — and the surplus has to go somewhere. Whenever Indian prices rise, Chinese steel arrives at our ports and pushes them back down. Think of a tap above a bucket: every time the water rises, the tap opens, and the level cannot get past a fixed line. India has fought back — a 12% safeguard duty on flat steel from April 2025, extended on a tapering scale — but every safeguard is temporary and every WTO challenge is a stopwatch.
The second force is CBAM. From January 2026 the European Union charges importers a carbon fee on incoming steel, linked to EU carbon prices of roughly €70–100 per tonne of CO₂. Indian steel is mostly blast-furnace steel, which is carbon-heavy, so the bill is large — the Global Trade Research Initiative estimates Indian exporters will have to cut prices 15–22% to absorb it. That matters because the EU took around 45% of India’s steel exports. Prices capped from above by China; the export door to Europe closing; raw-material costs gnawing from below — and on top of it all, the industry is doubling its capacity. This is the trap setting itself. The next section opens 20 years of data and shows it has already sprung.
5. The 20-Year Evidence
5.1 How we measure — and why we strip out Corus
To test the thesis, we need one clean ruler: Return on Capital Employed. We define it the simple way — operating profit (EBIT) for a year, divided by capital employed (total equity plus total borrowings) at the end of that year. It tells us, for every rupee tied up in the business, how many paise of profit it earned. In a Burlington trap the giveaway is unmistakable: the capital base swells while the return shrinks. ROCE catches that in a single number.
For Tata Steel there is one essential adjustment. In April 2007 Tata bought Corus, the British Dutch steelmaker, for about $12 billion — then the largest overseas acquisition by an Indian company. It nearly tripled revenue overnight and loaded the balance sheet with the equity Tata sank into the deal. If we leave that European investment in the capital base, we measure Tata’s Indian operating engine against capital that was deployed in Europe, and the picture blurs. So, throughout this article we use Corus-adjusted ROCE: we strip the carrying value of the Corus holding (T Steel Holdings) out of capital employed, year by year, verified against Tata’s annual reports, and measure operating profit against the Indian capital that actually produced it.
Figure 1 shows why this matters. Reported standalone ROCE understates the early years badly — because the idle Corus equity sat in the denominator — and the two lines only converge from FY16, when Tata wrote the Corus holding down to nil under Ind AS. The honest series, the one that speaks to the Indian business, is the blue line.
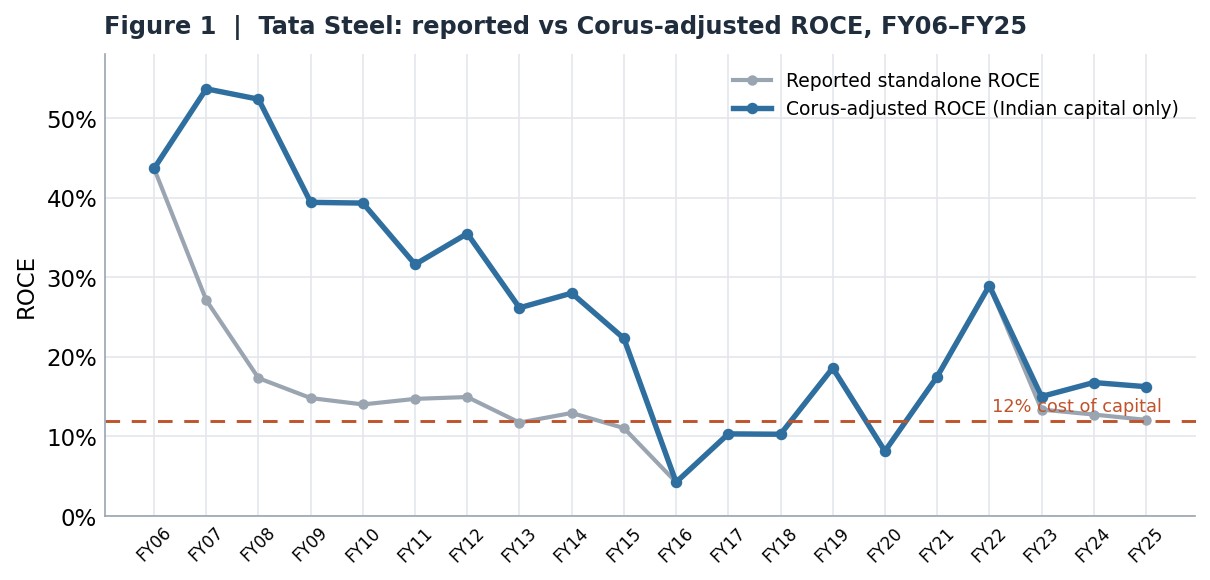 Figure 1. Tata’s Corus-adjusted ROCE (blue) measures the Indian business on its own. We use the blue series throughout. Source: Tata Steel annual reports FY06–FY13; screener.in FY16–FY25; TSH carrying values verified from primary ARs.
5.2 Volume up, capital up
Start with the easy part of the story — the part the industry is proud of. Tata Steel sold 4.55 million tons in FY06 and 20.9 million tons in FY25 (Figure 2). That is 4.6× the steel. JSW’s growth was steeper still, from 2 million tons to nearly 22 million. The mills were built, the furnaces were lit, the tons were delivered. Nobody disputes operational achievement.
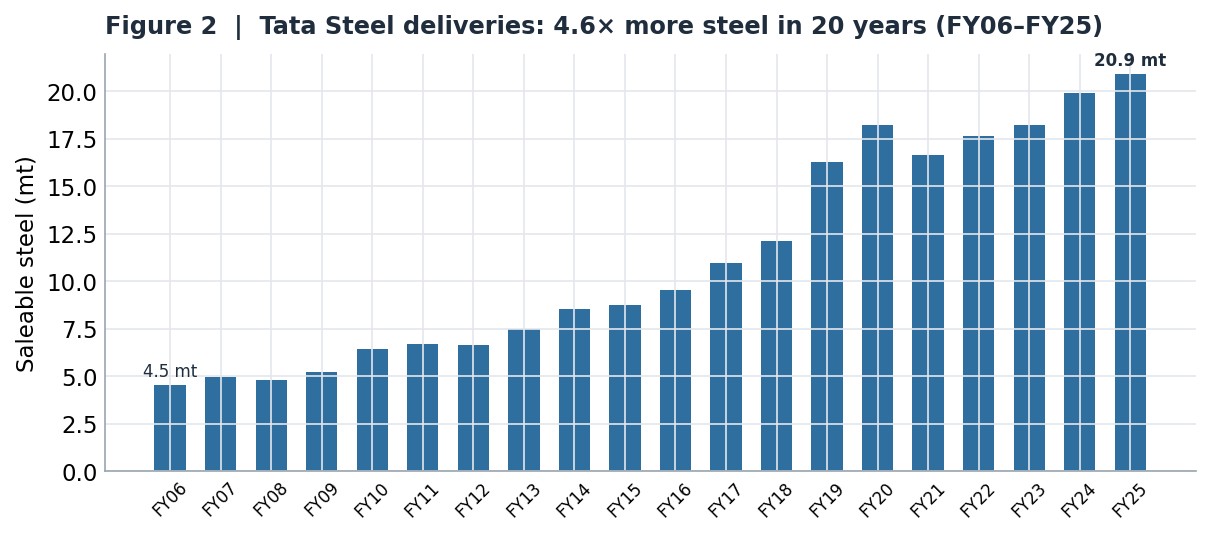 Figure 2. Tata Steel deliveries grew 4.6× over the period. The volume was never the problem. Source: Tata Steel standalone, FY06–FY25.
The capital grew faster than the steel. Tata’s Corus-adjusted capital employed went from ₹12,271 crore to ₹1,41,241 crore — 11.5×. JSW’s went from ₹8,027 crore to ₹1,48,209 crore — 18.5×. Together the two companies took their combined capital base from about ₹20,000 crore to about ₹2,89,000 crore, a 14× expansion. That is the denominator of the trap: an enormous, growing pile of invested capital.
5.3 Returns down
Now the numerator does its work. Figure 3 lays Tata’s Corus-adjusted ROCE next to JSW’s across the full 20 years, with the 12% cost-of-capital line marked. Both start high — Tata at 43.7%, JSW at 24.3% in FY06 — and both grind down. The path is jagged, because steel is cyclical, but the trend is one direction. The FY16 trough is brutal: Tata’s adjusted ROCE fell to 4.3% and JSW’s went negative. The FY22 post-Covid spike (Tata 28.9%, JSW 24.5%) looked like the old golden age had returned — for exactly one year — before gravity pulled both back down. By FY25 Tata sits at 16.3% and JSW at 8.8%.
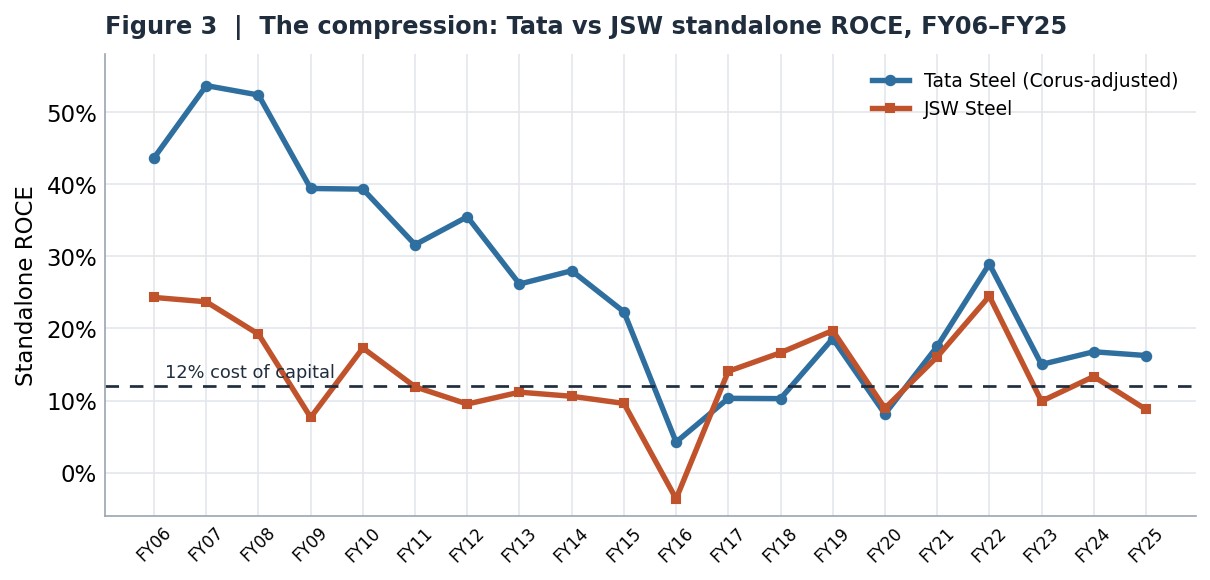 Figure 3. The compression. Tata (Corus-adjusted) holds just above the cost of capital; JSW, the more aggressive expander, has fallen below it. Source: workbook, FY06–FY25.
Look closely at the two lines after FY15 and a pattern emerges that is the heart of this article. Tata, with more captive ore and a richer product mix, holds above the 12% line in most years. JSW, the faster and more aggressive expander, spends more of its time below it. The company that built hardest is earning the least on its capital. That is the Burlington effect choosing its victims.
5.4 The per-tonne truth: more steel, no more margin
Volume growth would be worth celebrating if each ton earned as much as before. It does not. Figure 4 plots Tata’s EBITDA per ton across the period. In FY06 a ton of Tata steel produced ₹13,480 of EBITDA. In FY25, after 4.6× the volume and two decades of capex, a ton produced ₹13,976. Essentially flat in nominal rupees — with one cyclical spike to ₹29,709 in FY22 that promptly reversed. Twenty years of expansion did not move the per-ton economics.
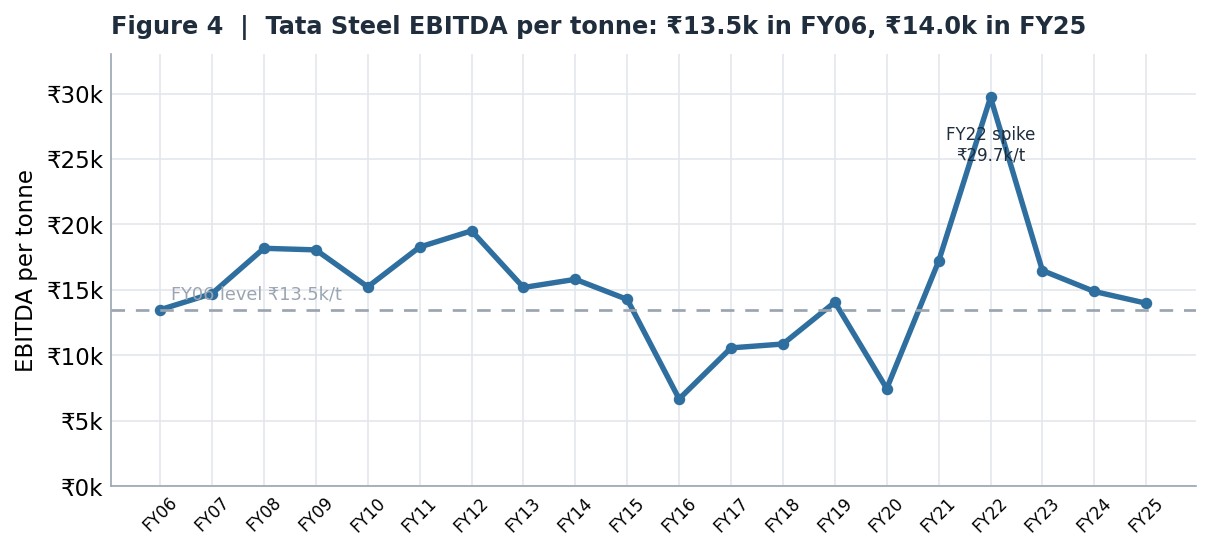 Figure 4. EBITDA per tonne ended almost exactly where it began — flat in nominal terms despite 20 years of investment. Source: Tata Steel standalone, FY06–FY25.
And “flat in nominal rupees” is generous, because the rupee itself lost value. Figure 5 deflates Tata’s realization per ton by inflation, in FY06 rupees. The nominal line (grey) looks like it climbed comfortably. The real line (red) tells the truth: measured in constant purchasing power, Tata’s realization per ton is 44% below where it was in FY06, and at FY20 trough it was 62% lower. This is the Burlington mechanism made visible. The mills got bigger and the steel got cheaper in real terms. The buyer captured the gain; the shareholder did not. Buffett’s line about the dollar losing two-thirds of its value while Burlington’s stock stood still is not a metaphor here — it is the same chart.
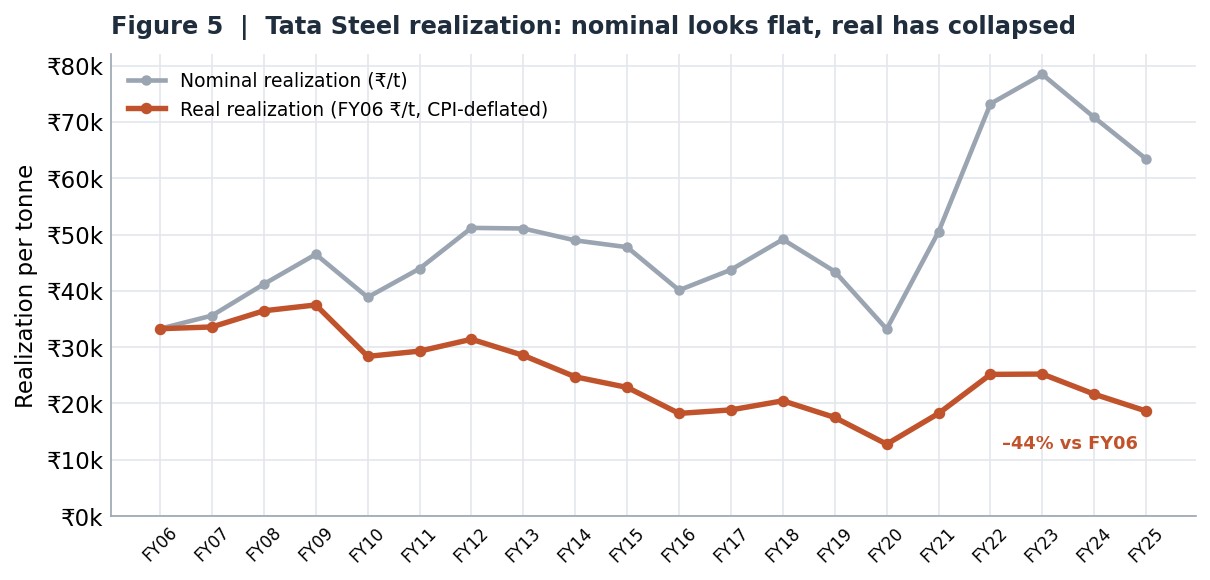 Figure 5. Nominal realization looks healthy; in real (CPI-deflated) terms it has fallen 44% since FY06. The savings flowed to the buyer. Source: workbook, MoSPI CPI rebased FY06=100.
5.5 The chart that holds it all
Figure 6 puts the two halves of the trap on one canvas. The bars are the cumulative capex the two companies poured in — from a standing start to about ₹2.07 lakh crore over twenty years. The line is their combined Corus-adjusted ROCE. As the bars climb relentlessly, the line falls from 36% toward the 12% floor. More plants, more debt, more tons, lower returns. That is the Burlington shape, drawn from audited Indian accounts rather than a 1985 American letter.
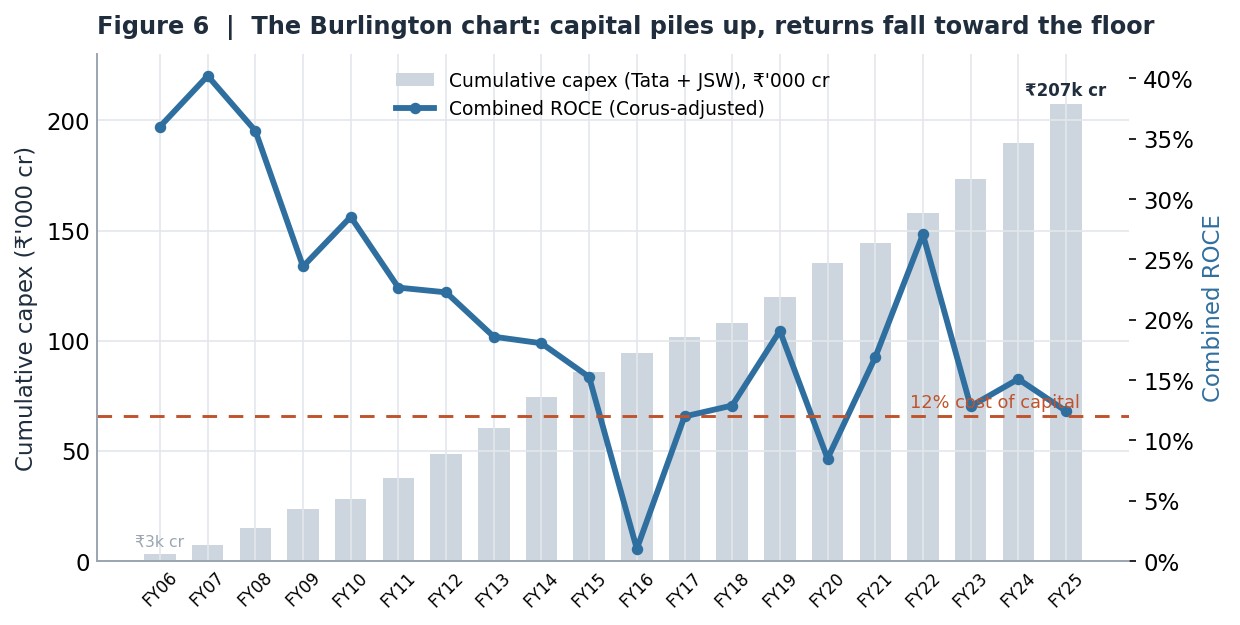 Figure 6. The Burlington chart. Cumulative capex (bars) rises to ₹2.07 lakh crore while combined ROCE (line) sinks to the 12% cost-of-capital floor. Source: workbook, Corus-adjusted, FY06–FY25.
5.6 The incremental rupee
The legacy book can still earn something — a furnace bought cheaply decades ago, long depreciated, may throw off a fair return. The real test is the marginal rupee: what does each new rupee of capital deployed earn in extra profit? Measured over the full 20 years, Tata’s Corus-adjusted incremental ROCE — the change in EBIT divided by the change in adjusted capital — is about 13.6%, barely above the cost of capital. JSW’s is about 7.9%, comfortably below it. On a three-year rolling basis, the marginal return has been in single digits or negative for most of the last decade for both companies.
This is the number that should keep a board awake. The rupee being deployed today — for the 300 MTPA push, for the next blast furnace — is the marginal rupee. For JSW it is already earning below its cost. For Tata it is hovering right at the edge. The Burlington thesis is not a forecast about what might happen. The data shows the trap is already closing on the money going in now.
6. The Escape Doors — and Why Traffic Through Them Is Light
There are ways out of the box. Three of them.
Door 1 — Specialty steels. A specialty steel does a job ordinary steel cannot: auto-grade that bends without cracking, electrical steel that passes magnetic fields without loss, defence plate that stops a round. These are not commodities; the buyer needs this steel for this application, which gives the seller pricing power. JSW reports roughly 60% of sales as “value-added” on its own broad definition; Tata has electrical-steel projects underway; AM/NS is going hard at automotive grades. But the moat is shallow — auto OEMs run reverse auctions among qualified suppliers and take the lowest bid. A specialty mill is less a toll bridge than a single-lane road two trucks can still share.
Door 2 — Downstream brands. The further you travel from the blast furnace toward the customer, the more pricing power you keep. A ton of HRC is a commodity; a branded TMT bar sold to a homeowner through a dealer is a product. Tata has taken this seriously — Tiscon rebar, Pravesh steel doors, the Aashiyana retail platform — and these earn margins the underlying HRC never could.
Door 3 — Owning the inputs. Iron ore and coking coal are roughly half the cost of a ton of blast-furnace steel. Own the mines and you keep the supplier’s margin and lock in supply through shortages. Tata has captive ore at Joda and Noamundi; JSW has invested abroad in coking coal. The saving is real — perhaps ₹2,000–4,000 per ton. But two cautions apply. Captive ore can be taken away, as India’s 2010–14 mining bans showed.
All three doors are real. All three are partly open. None of them is where the bulk of new capital is going. The 80–100 MTPA arriving by 2030 is dominated by the most commodity-like products.
7. What Would Falsify This Thesis
A position you cannot specify a falsification test for is not a position; it is a strong feeling. So here are the conditions under which I would be wrong, each checkable from public filings over the next five years.
- Sustained recovery. If either company earns 15% or higher ROCE on a consolidated basis for three consecutive years across a normal cycle — not one post-Covid spike — the thesis on that company weakens. This has not happened in any rolling three-year window in the last decade.
- Specialty mix above 30%. If either takes true specialty product (auto, electrical, defence, engineered downstream — on a tight definition, not broad “value-added”) above 30% of revenue and holds it, pricing power becomes real and the Burlington mechanic loosens for that company.
- Chinese consolidation. If China closes 100–150 MTPA of capacity in a sustained way, the import cap on Indian prices lifts and the math improves for the whole industry. Beijing has signalled this for years and rarely delivered. I do not expect it — but if it happens, my industry view improves materially.
- A carbon premium. If CBAM-style rules spread beyond Europe and Indian mills decarbonise faster than planned, Indian steel could become a premium low-carbon product rather than a discounted one. None of the three preconditions is visible in current data.
And what would not falsify it: a single good price year (we saw that in FY22); rising capacity-utilisation rates (the thesis is about returns, not throughput); higher safeguard duties (temporary, and they only delay the trap); a new steel policy with bigger numbers (that is the trap getting larger, not smaller).
8. Conclusion: The Question Indian Steel Has Not Asked Itself
End where we began. In 1985 Buffett looked at 21 years of Burlington’s capital deployment — $3 billion of capex, a stock price that had not moved in real terms — and asked what return all that capital had earned. The answer was: not enough.
Indian steel is approaching the same reckoning, and not in 21 years. Twenty years of audited data from its two largest private producers show the Burlington shape exactly: a combined capital base up 14×, operating profit up 5×, returns compressed from 36% to the 12% floor, the per-tonne margin flat in nominal terms and down 44% in real ones, and the marginal rupee now earning at or below its cost. The capacity trap explains why this will not self-correct — nobody closes, so the global surplus never clears — and China and CBAM make India’s version tighter than Burlington’s ever was.
This does not mean these are bad companies or weak managers. Each capex project clears its NPV hurdle. Each board approves with care. Each team executes well. That is not the point, and it never was. The point of the 1985 letter is that excellent management of a structurally hard industry produces an excellent operator — not an excellent business. The structure beats the manager, almost every time. A horse that can count to ten is a remarkable horse. It is not a remarkable mathematician.
The volume will sell. India’s demand growth is real; the infrastructure boom is real. None of them answers the question, which is what the capital earns. At the end of 2030, when the next 80 million tons of capacity is online, how much of the money being committed today will have earned its cost? If history rhymes, the answer is Burlington’s: not enough.
The 1985 letter is not a prediction. It is a mirror. It is the question every CEO, every board director and every long-term shareholder in this industry should ask now — while the plans are still on the drawing board, the financing still being structured, the next furnace still a circle on a site map. What return will this capital earn? If the honest answer is “less than its cost,” there is still time to choose a different path. Indian steel can decide what it sees.
Methodology and Sources
Period and scope. All financial data covers FY06 to FY25 (fiscal years ending 31 March). Two companies are analysed on a standalone basis: Tata Steel Limited and JSW Steel Limited, the two largest private Indian producers. Tata’s figures are presented on a Corus-adjusted basis throughout — the carrying value of T Steel Holdings (the Corus parent) is removed from capital employed each year so that operating profit is measured against the Indian capital base that produced it.
Definitions. EBITDA: earnings before interest, tax, depreciation and amortisation, per the Statement of Profit and Loss. EBIT: EBITDA minus depreciation and amortisation. Capital Employed: total equity plus total borrowings at year-end — a deliberate simplification chosen for cross-period and cross-company comparability. ROCE: EBIT divided by Capital Employed for the same year. Incremental ROCE: change in EBIT divided by change in (adjusted) capital employed, measured cumulatively from FY06. Real realization: nominal realization per tonne deflated by India’s CPI (MoSPI All-India General Index, rebased FY06 = 100).
Data sources. Tata FY06–FY13 and JSW FY08–FY13 from audited annual reports (PDFs verified); FY16–FY25 from screener.in standalone filings; TSH (Corus) carrying values verified year-by-year against primary annual reports. FY14–FY15 are flagged gap years drawn from earlier aggregates. Cost of capital is taken at 12% as a working hurdle for an Indian integrated steel maker.
External references. OECD Steel Committee capacity estimates (March 2026) and “Barriers to exit in the steel sector” (OECD); BCG, “Solving Steel’s Value-Added Riddle”; National Steel Policy 2017 (Ministry of Steel); Global Trade Research Initiative (CBAM impact); Directorate General of Trade Remedies (safeguard duty). Steel-capacity and trade figures are drawn from these public sources; all company financial figures are the author’s own from filed accounts.