Adani Ports and SEZ against JSW Infrastructure. Two Indian port companies, one common method, and a result neither presentation shows you.
Data through FY26, the year ended 31 March 2026. All figures in Indian rupees unless stated, converting at Rs 87 to the dollar. Sources are company results, annual reports, filed accounts and Ministry of Ports data. This is analysis, not investment advice.
The finding in one line. Adani charges twice the toll and spent twice the capital. JSW charges half and spent half. After eleven years for one and nine for the other, both earn about the same return on capital, and both get their money back in roughly seven years. Scale has bought Adani a bigger version of the same business.
| 7.0
years of EBITDA to repay Adani’s capital |
6.8
years of EBITDA to repay JSW’s capital |
10.9%
Adani ROCE, FY26, common method |
11.2%
JSW ROCE, FY26, same method |
2.1x
Adani’s EBITDA per tonne against JSW’s |
If the vocabulary below is new, the companion post walks through how a port earns its money, one ship and one cargo at a time.
1. Five things worth knowing
One. The returns have converged, and neither has improved. Adani’s return on capital was 10.5% in FY15 and 10.9% in FY26. JSW’s was 12.4% in FY17 and 11.2% in FY26. In between, Adani grew revenue at 18% a year for a decade and JSW at 27% for five years. None of that growth showed up in returns. Every extra tonne came with its own capital bill, and the return stayed where it was.
Two. The gap in the toll is a structural gap, not an efficiency gap. Adani keeps Rs 456 of EBITDA per tonne. JSW keeps Rs 214. Section 4.2 takes that gap apart bar by bar. Almost all of it comes from things Adani owns and JSW does not, and almost none of it comes from Adani running a crane better.
Three. Adani has quietly changed from a builder into a buyer. Capital employed per tonne rose from Rs 1,978 in FY15 to Rs 3,185 in FY26. That is what happens when you buy ports at market prices instead of reclaiming salt marsh. The toll per tonne nearly doubled over the same period. The return did not move.
Four. The famous 21% port return is a segment number, not a company number. Adani’s domestic ports business earned 23% on capital in FY26. The group earned 11%. The difference is logistics at 10%, international ports at 8%, and a large corporate capital base. Anyone underwriting a port company on the segment figure is buying something that does not exist at the consolidated level.
Five. JSW’s growth is contracted but low priced. Adani’s is open market but premium. JSW’s parent is taking steel capacity from 35.7 to 51.5 million tonnes. That is cargo JSW does not have to win. The projects carrying it are captive terminals and take or pay pipelines. They price low. JSW’s EBITDA margin has fallen from 58.9% in FY18 to 48.6% in FY26, and its own FY28 guidance implies a further fall to about 46%.
2. The two businesses at a glance
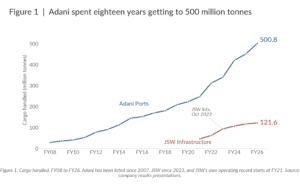
Adani has been listed since November 2007. JSW listed in October 2023, and its own operating disclosure starts at FY21. That is why one line is long and the other is short. JSW covered a similar multiple in five years that Adani covered in eighteen.
| Particulars | UoM | Adani Ports | JSW Infrastructure | Ratio |
| SCALE, FY26 | ||||
| Cargo handled | MMT | 500.8 | 121.6 | 4.1x |
| Installed capacity | MTPA | 653 | 183 | 3.6x |
| Capacity utilisation, domestic | % | 69.1 | 66.4 | 1.0x |
| Share of all India port volume | % | 30.0 | 7.3 | 4.1x |
| Ports and terminals | Nos | 19 | 12 | |
| PROFIT AND LOSS, FY26 | ||||
| Revenue from operations | Rs Cr | 38,736 | 5,361 | 7.2x |
| Operating EBITDA | Rs Cr | 22,851 | 2,604 | 8.8x |
| Operating EBITDA margin | % | 59.0 | 48.6 | 1.2x |
| Profit after tax, reported | Rs Cr | 12,782 | 1,547 | 8.3x |
| Finance cost as share of EBITDA | % | 20.4 | 14.7 | 1.4x |
| UNIT ECONOMICS, FY26 | ||||
| Revenue per tonne | Rs/t | 773 | 441 | 1.8x |
| EBITDA per tonne | Rs/t | 456 | 214 | 2.1x |
| Capital employed per tonne | Rs/t | 3,185 | 1,462 | 2.2x |
| Years of EBITDA to repay capital | yrs | 7.0 | 6.8 | 1.0x |
| CAPITAL AND RETURNS, FY26 | ||||
| Capital employed | Rs Cr | 159,525 | 17,776 | 9.0x |
| ROCE, common method | % | 10.9 | 11.2 | 1.0x |
| ROCE, as each company reports it | % | 16.0 | 13.5 | 1.2x |
| Net debt | Rs Cr | 42,910 | 3,101 | 13.8x |
| Net debt to EBITDA | x | 1.9 | 1.2 | 1.6x |
| Free cash flow conversion, FY22 to FY26 | % | 39.1 | 34.6 | 1.1x |
| MIX AND OWNERSHIP | ||||
| Containers as share of cargo | % | 45 | 2 | |
| Cargo belonging to the promoter group | % | nil | 52 | |
| Largest single asset, share of volume | % | 38.3 | 20.2 | |
| Industrial and logistics land bank | Ha | 16,000 | 114 | 140x |
| Promoter holding | % | 68.0 | 83.6 |
Common method ROCE is EBIT divided by net worth plus gross borrowings, applied identically to both. Adani’s largest asset is Mundra at 192 MMT. JSW’s is Dharamtar at 24.5 MMT. Adani has no captive parent cargo the way JSW does, though it does handle Adani group power and edible oil volumes.
3. What is the same, and why that matters most
The similarities between these two say more about the port business than the differences do. Start there.
3.1 Payback lands at about seven years for both
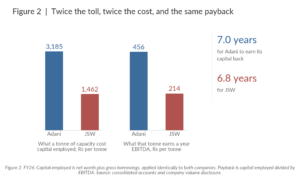
Adani carries Rs 3,185 of capital for every tonne of annual cargo and earns Rs 456 of EBITDA on it. That is 7.0 years to get the money back. JSW carries Rs 1,462 and earns Rs 214. That is 6.8 years. Adani’s tonnes are worth more, and they cost more in almost exactly the same proportion.
This is what a competitive market for infrastructure assets looks like. Premium locations, deep water, container franchises and marine fleets all get priced into the entry cost. The moat is real. You just pay for it up front.
3.2 Neither company has improved its return in a decade
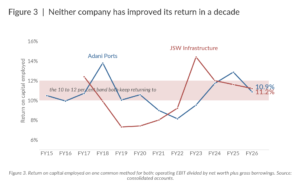
Adani’s return peaked at 13.8% in FY18 and was 10.9% in FY26. Over that period revenue went from Rs 11,323 crore to Rs 38,736 crore. JSW’s peaked at 14.4% in FY23, when its balance sheet was briefly light after the IPO, and settled at 11.2% by FY26.
The reason is structural. Every extra tonne needs a berth, a crane, a dredged channel and a rail siding, bought at today’s prices. Ports do not get more profitable as they get bigger. They just get bigger.
3.3 Both have about a third of their capacity sitting idle
Adani ran its domestic ports at 69% of capacity in FY26. JSW ran at 66%. That is roughly 200 million tonnes and 60 million tonnes of unused berth. Spare capacity on this scale is why neither can push prices much, and also why both can add volume for a while without much new capital.
4. What is different, and why
4.1 Where the money comes from
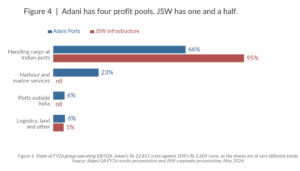
Here is what each of those four businesses sells.
Handling cargo at Indian ports. The core. Cranes, conveyors, wharfage per tonne, and rent on cargo that sits in the yard past its free days. Both companies do this, and for JSW it is almost the whole company.
Harbour and marine services. Every ship that comes into a port needs a pilot to steer her in and tugs to push her alongside. Channels need dredging. Adani sells all of that itself, with 183 vessels and 64 dredgers. It shows up in two places. The captive part, Rs 4,278 crore of revenue at an 89% margin, is charged to ships calling at Adani’s own ports and sits inside the ports segment. The third party part, Ocean Sparkle, tows ships at other operators’ ports and brings in no Adani cargo at all. Together they are 23% of group EBITDA. JSW buys these services instead of selling them, so this line is nil.
Ports outside India. Haifa in Israel, Colombo West in Sri Lanka, Dar es Salaam in Tanzania and North Queensland in Australia. Together 49.8 million tonnes and Rs 1,298 crore of EBITDA in FY26. Real cargo, much thinner margins.
Logistics, land and other. Rail rakes, trucks, warehouses and agri silos, which earn after the cargo has left the port gate. Plus rent, utilities and land sales from the SEZ at Mundra. JSW’s small second business is a logistics arm running near a 19% margin.
Two of those four earn money with no port tonnes behind them. Keep that in mind for the next chart. Those earnings still land in the per tonne number.
4.2 The toll gap, one bar at a time
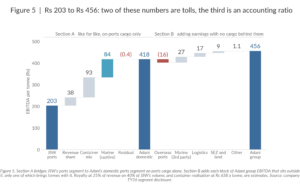
Three numbers get quoted for these companies, and only two of them mean the same thing. Here is the walk from one end to the other.
JSW ports, Rs 203. The starting point. JSW’s ports segment EBITDA divided by the 121.6 million tonnes that segment handled. The headline Rs 214 you see elsewhere is the group number, which mixes in the logistics business. Strip that out and you get a clean toll.
Revenue share, plus Rs 38. Seven of JSW’s twelve operating assets are terminals inside government major ports. It is a tenant there. It pays the port trust a share of revenue for the right to be on the quay. This bar asks a simple question: what would JSW keep if it owned its quays outright, the way Adani mostly does? This is the softest number in the chart. JSW does not disclose the rate.
Container mix, plus Rs 93. Containers were 45% of Adani’s tonnage and about 2% of JSW’s. A tonne inside a box pays several times what a tonne of coal pays to cross the same quay. This bar prices that difference at Adani’s own cargo handling margin. Nothing to do with skill. It is what the cargo is.
Marine, captive, plus Rs 84. Adani’s harbour services EBITDA spread over its domestic tonnes. This is a disclosed figure, not an estimate, and it is the single largest explained block in the walk. JSW pays somebody else for this service. Adani charges for it.
Adani domestic ports, Rs 418. The second anchor. Adani’s domestic ports segment EBITDA over its 451 million domestic tonnes. This is the number that compares to JSW’s Rs 203, and the gap between them is now fully accounted for.
Overseas ports, minus Rs 16. The only bar in Section B that brings cargo with it. Those 49.8 million tonnes earn about Rs 261 each, well below Rs 418, so adding them pulls the average down. North Queensland was consolidated only from the fourth quarter, so this is less than a full year of it.
Marine, third party, plus Rs 27. Ocean Sparkle again. Rs 1,357 crore of EBITDA, and not one tonne of Adani cargo behind it.
Logistics, plus Rs 17. Rs 863 crore, earned after the cargo has left the gate.
SEZ and land, plus Rs 9. Rs 427 crore of rent, utilities and land monetisation. Paid whether a ship calls or not.
Adani group, Rs 456. The headline.
What is estimated here. Four inputs are not disclosed by either company. The royalty rate is taken at 25% of revenue on the 40% of JSW’s volume that sits inside major ports, against a bid range of 15% to 40% seen in Indian concessions. Container realisation is taken at $110 per box, inside the published band of $80 to $150. At 15 tonnes per box and Rs 87 to the dollar, that is Rs 638 a tonne. The sanity check is that this leaves non container cargo at an implied Rs 344 a tonne, which is $4, inside the $3 to $5 band that Indian bulk handling normally bills. Everything else in the chart is company disclosure.
4.3 Why Adani’s tonnes cost twice as much
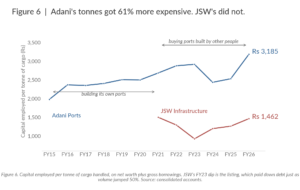
Adani carries Rs 3,185 of capital for every tonne it handles. JSW carries Rs 1,462. The two companies bought different things.
Adani owns more of the chain. The land, the water, the dredged channel, the breakwater, the berths, the cranes, and in several places the rail line into the port. Then come the things JSW does not own at all. A fleet of 183 tugs and support vessels. 64 dredgers. 16,000 hectares of land. A logistics arm and four ports abroad. All of that capital sits in the same denominator as the tonnes. The marine fleet earns 23% of group EBITDA, and it also has to be paid for.
JSW rents a good part of its estate. Thirty eight per cent of its capacity sits inside government major ports. There the government owns the land and the water, and the tenant builds the cranes and the sheds. You get a lighter balance sheet and a smaller bill. You also hand over a slice of revenue and inherit an expiry date. JSW holds 114 hectares of land against Adani’s 16,000, and it buys tug and pilot services instead of owning the boats.
The shape of Adani’s line matters as much as its level. From FY15 to FY20 it barely moves, sitting near Rs 2,400. That was the building era. Adani was adding berths to ports it had already reclaimed, and volume grew about as fast as the spending did.
From FY21 the line climbs. Krishnapatnam, Gangavaram, Dighi, Karaikal, Gopalpur, Haifa, Colombo and North Queensland all arrived by acquisition. Each one was bought from a seller who also knew what a port is worth. Mundra was salt marsh. Gangavaram was not. When you buy a moat you pay for it on day one, and the price shows up in this chart.
The FY26 step from Rs 2,530 to Rs 3,185 is mostly the North Queensland deal, which was paid for in shares. Net worth rose Rs 33,690 crore during the year. Retained profit was about Rs 11,120 crore. So roughly Rs 22,600 crore of the increase came from issuing equity, not from earning it, and promoter holding went from 65.9% to 68.0%. Treat about a third of the FY26 spike as a timing effect. The terminal joined the balance sheet in full, but only its fourth quarter cargo joined the tonnage.
JSW’s line is flat and low, which is what the tenant model is for. The FY23 dip is the listing, which paid down debt in the same year volume jumped 50%. One year, not a trend. The rest of the line does what the model promises. Less capital per tonne, less revenue per tonne, and a return on capital within a whisker of the landlord’s.
5. In summary
Two Indian port companies. One is four times the size of the other, charges twice as much per tonne, and reports a 59% margin against 49%.
Put both on one method and the toll gap comes apart cleanly. Adani keeps more per tonne for three reasons. It owns its quays instead of renting them. Nearly half its cargo travels in containers. And it sells the tugs and pilots that JSW buys. Strip those three out and the difference is zero. Nothing in the numbers says one company runs a port better than the other.
The rest follows from that. Adani’s tonnes earn twice as much and cost twice as much, so both companies get their capital back in about seven years and both earn 11% on it. Neither has improved that return in a decade. Each new tonne arrives with a berth, a crane and a channel to pay for, bought at today’s prices. Adani’s capital per tonne sat flat while it was building ports, and has climbed since it started buying them. JSW’s stays low because the government owns the land under a good part of its estate.
Two numbers are worth carrying out of this. The first is Rs 418 against Rs 203, the like for like toll. The headline Rs 456 mixes in tugs, trucks and land rent that bring no cargo with them, so it flatters the comparison. The second is 11%. That is what both companies earn on the money invested, and neither presentation leads with it.
Prepared from FY26 filings. Figures marked as estimates should be checked against primary filings before they are relied on. This is analysis, not investment advice.